
Post Processing GPR Data
When talking to new customers about what we do at United Scanning, there is often the misconception that we will simply come to their site, scan the surface that they wish scanned and be able to tell them everything they want to know immediately from that scan. While this is sometimes the case, there are times when a more detailed and analytical examination of the scanning data is required to reveal underlying structures, services and geometries.
When our client requires clearer imagery of the scanned area or surface or wants a 3D representation of the structures below, the United Scanning team usually need to perform some degree of post processing on the data that has been collected. We use state of the art software including RADAN from GSSI and GPR-Slice from the Geophysical Achaeometry Laboratory in California to perform this post processing.
Post processing involves using advanced software to “clean up” and improve the quality of the raw data acquired while on site. The properties of the concrete or soil scanned, the presence of other sources of noise or interference and reflections from small interfaces between more and less radar transparent substances (like small pieces of rock, grit and aggregate) are among the onsite factors that may combine to make it necessary to “clean up” some scans.
Depending on what factors are influencing the data that has been collected, there is a broad variety of post processing steps that can be taken to rectify them. By no means all of the many steps that United Scanning technicians perform include:
Time zero correction Ground penetrating radar often relies upon a coupling effect that occurs between the radar signal and the ground material. However, due to the sensitivity of this coupling to temperature, moisture, the distance of the antenna from the surface and other factors, this coupling effect can alter the shape of the signal, delay its time of return and reduce the frequency of the signal. These effects are microscopic, measured in tiny increments like tenths of nanoseconds, yet they can have real world impact on the data, altering depth readings and thus need to be correct for. Unfortunately the time zero position is not a constant and will vary with every scan, site and ground material or concrete. United Scanning use software to assist them to find the first positive peak in the returning signal and adjust the time zero to get a more accurate picture.
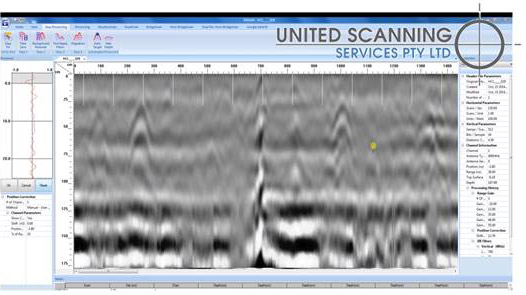
Figure 1: Zero time correction involves selecting the first true response from the scanned area
- Background removal A given GPR scan will have reflections not only from the things our customer wants to see (the target) but also from many unwanted objects that may clutter up the image. Added to the clutter is background noise and both these factors can make the actual target difficult to see and assess. Background removal involves the use of a horizontal high pass filter to determine what is valid signal reflected off the target and what is just clutter and noise and attempt to filter out most of the effect of the clutter and noise.
- Gain correction It’s not uncommon for visitors to our processing centre to look at images from recent scans and ask what the static is. A scanning image can sometimes just look like a screen full of random noise. Gain correction can help by making areas of particular interest or importance more obvious. It works by applying a multiplier effect to successive regions of the scan in terms of the time and/or the intensity of the reflected signal so that that time and/or intensity stands out more clearly against the background. It is also possible to apply predefine color schemas to the data so that specific areas of the scan have a different color to indicate different factor and make interpretation easier.
- Migration Ground Penetrating Radar produces a cone of radar and the reflected signal returning from reflections of portions of that cone is the basis of the images produced. Signal on the leading edge of the cone will have a longer journey through the concrete to the target than signal at the centre of the cone.
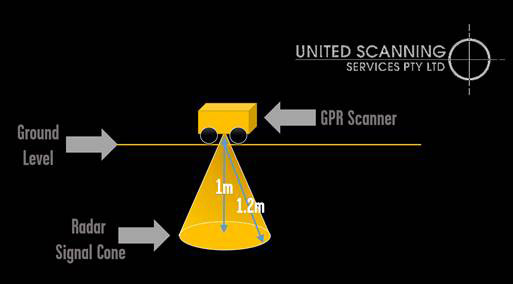
Figure 2: GPR produces a signal cone which results in targets appearing as a hyperbola
Because of this, when the target is not directly under the scanner, the returning signal will take longer and the position of the target will appear deeper. As the target comes closer to the centre of the signal cone, the depth of the target will appear to decrease. Thus, as the scanner passes over the scanning target, the returning signal appears in the data as a hyperbola.
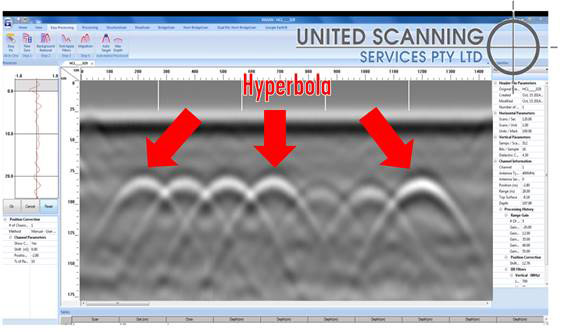
Figure 3: The appearance of hyperbola in a scan
The process of migration is the application of complex mathematical algorithms to attempt to resolve the hyperbola in the scanning data to an accurate representation of the target in a spatially correct way.

Figure 4: Migrated scanned data with spatially correct positions
3D Rendering When a scan has been performed in great enough detail or has been performed from the start with the intention of creating a 3D volume, data that has been processed appropriately can be rendered into a 3D volume. This provides a much more understandable picture of the underground or in-concrete conditions and can be exceptionally useful for presenting to clients and non-expert stakeholders the factors that our customers are trying to address.
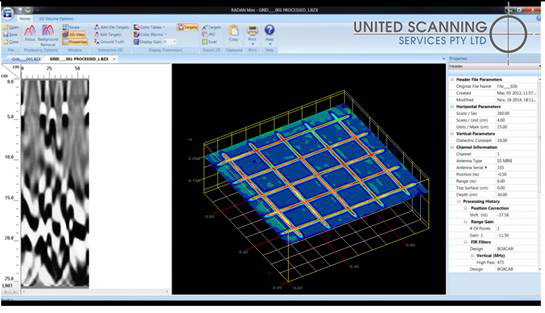
Figure 5: 3D Rendered volume of scanned reinforced concrete
Anyone with enough money can buy a GPR scanner and push it over a surface. Our experienced technicians have the experience and the advanced software to process and interpret the results and perform post processing to provide greater levels of detail and accuracy.